

Eccles Command:
From tens of thousands of quote lines to a clear briefing every Monday morning.
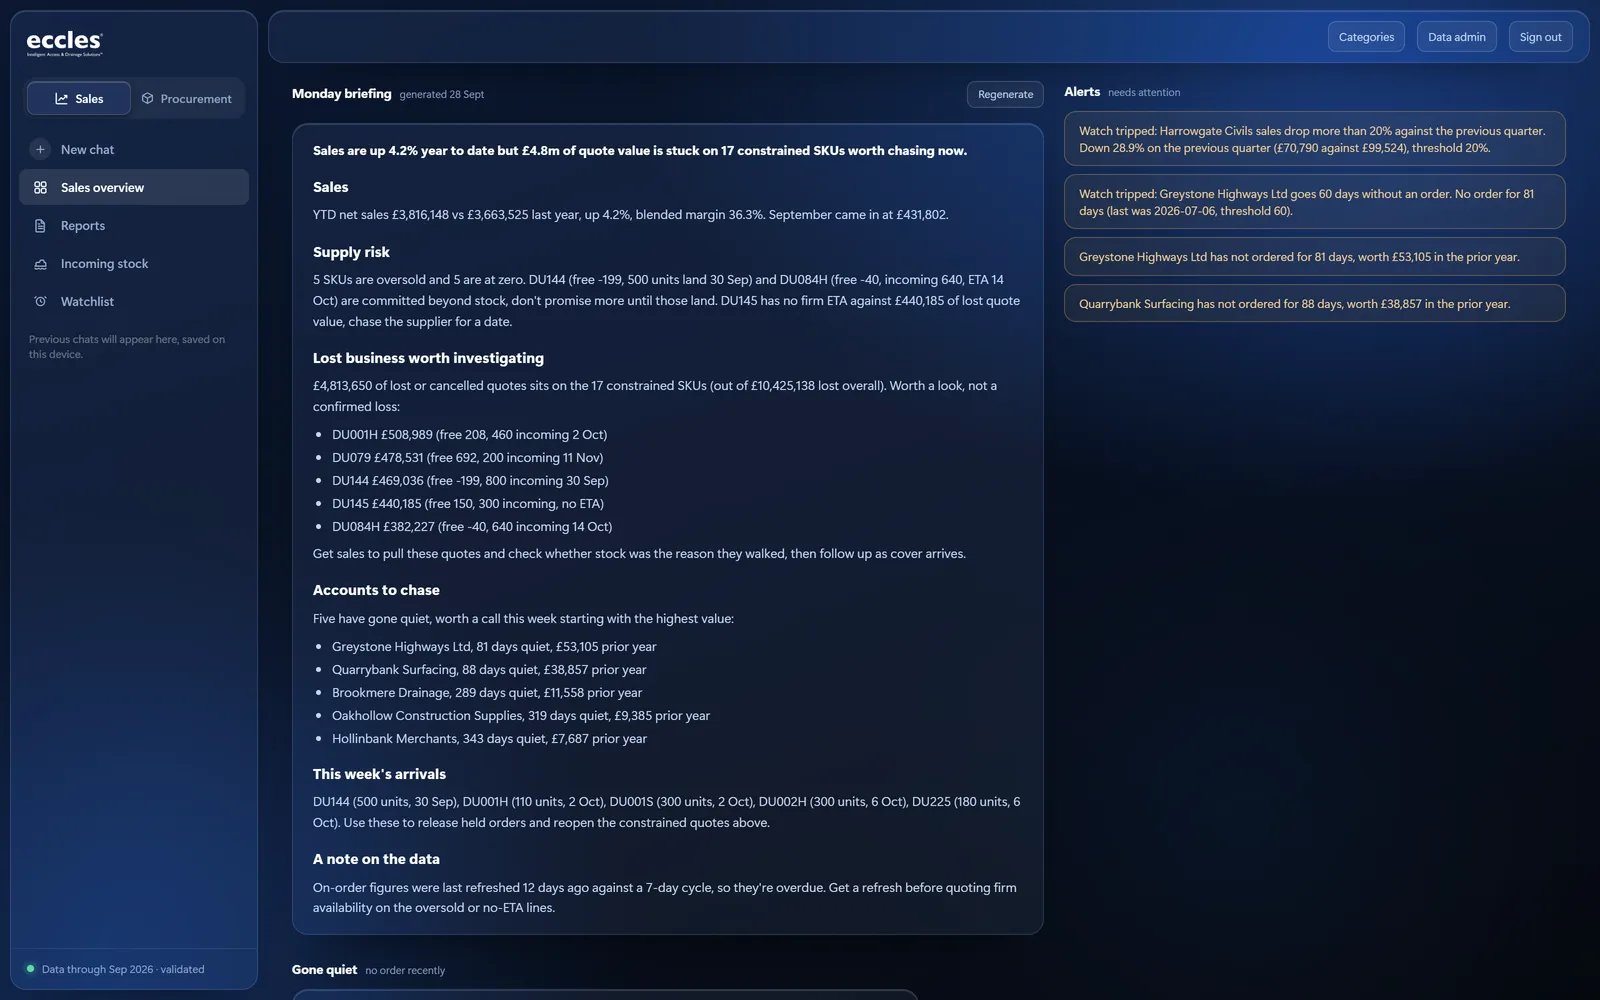
Eccles-branded demo on dummy data. No real Eccles accounts, figures or stock are shown.
01Challenge
Eccles held years of sales and stock data, but getting answers from it meant exporting quote reports and working through them in spreadsheets. Is this account down on last year? Which branches have stopped ordering? What do we need to reorder before we run short? Each question took hours, and small errors in the data, such as the wrong categories included, could quietly skew every number. Purchasing decisions leaned on experience rather than on demand and lead-time data.
- 01Is this account down on last year?
- 02Which branches have stopped ordering?
- 03What do we need to reorder before we run short?
02What we built
- 01
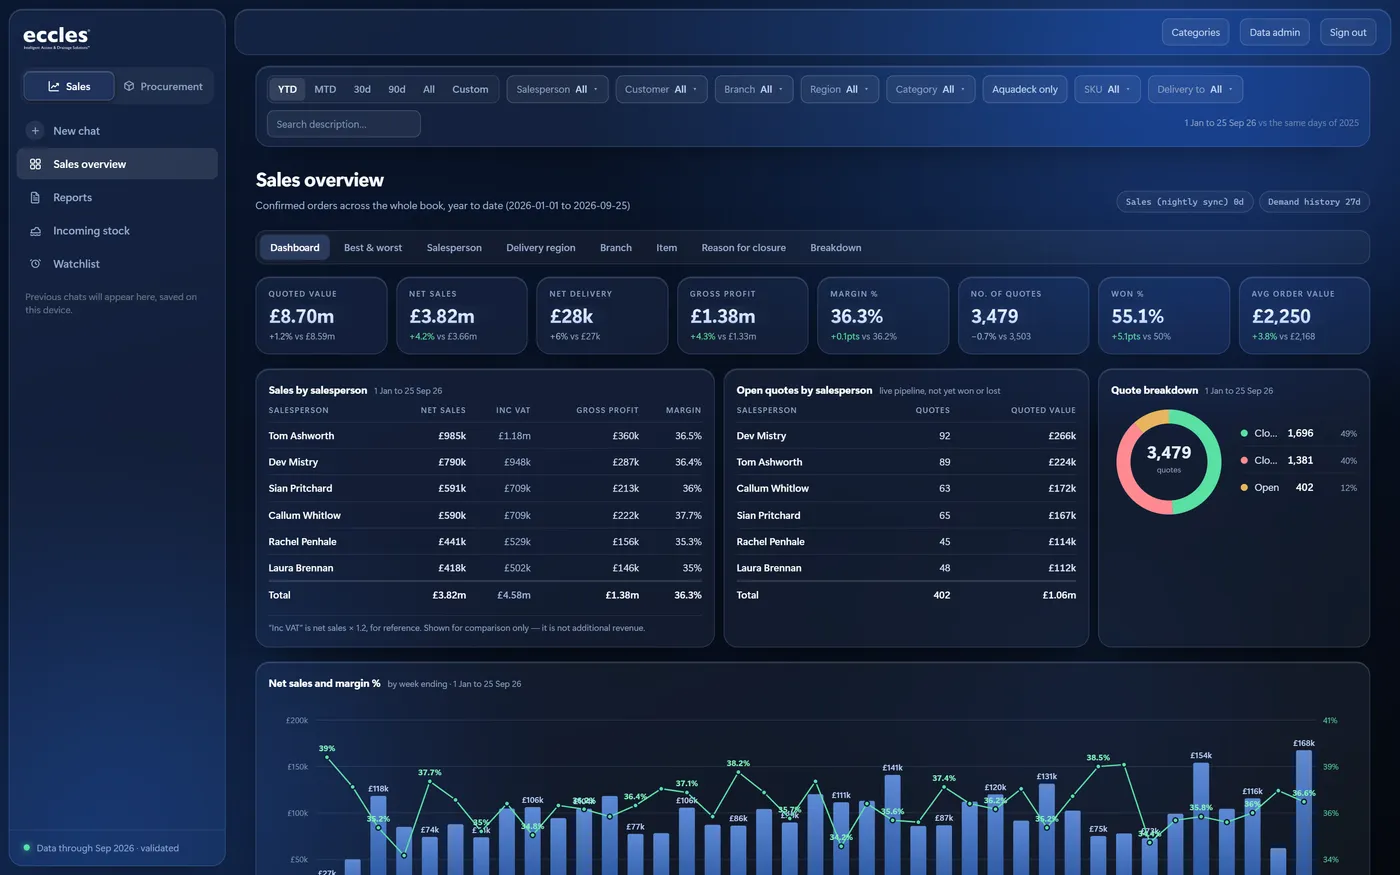
Sales module.
Year-to-date dashboards filtered by salesperson, customer, branch, region, product category and SKU. Best and worst performers, open quotes, like-for-like comparisons and a watchlist for accounts that need attention.
- 02
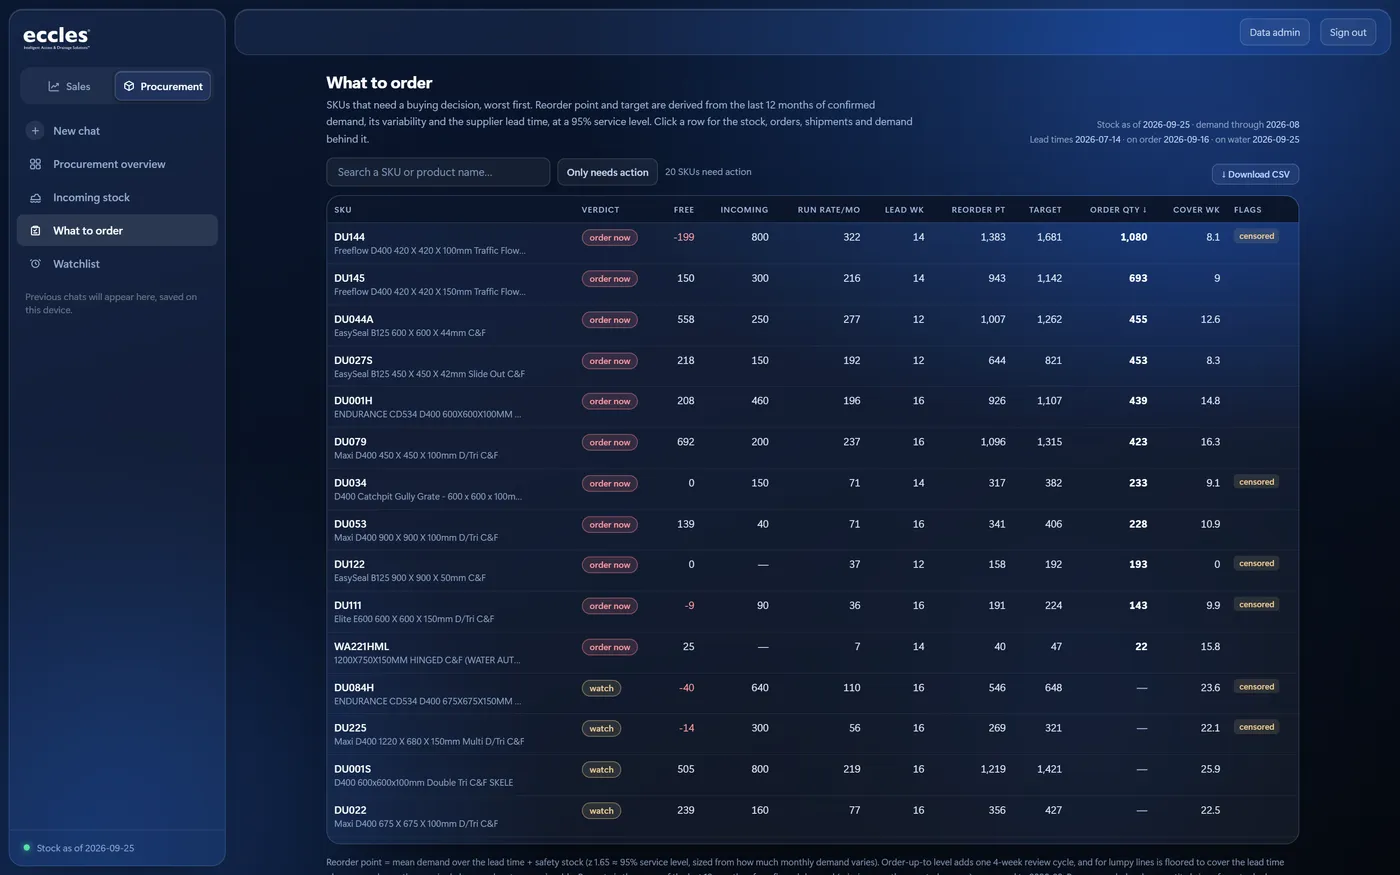
Procurement module.
Stock value, oversold items, stock on order and stock in transit. Reorder points and targets set to a 95% service level, calculated from demand variability and supplier lead times, with a “what to order” list ready to export.
- 03
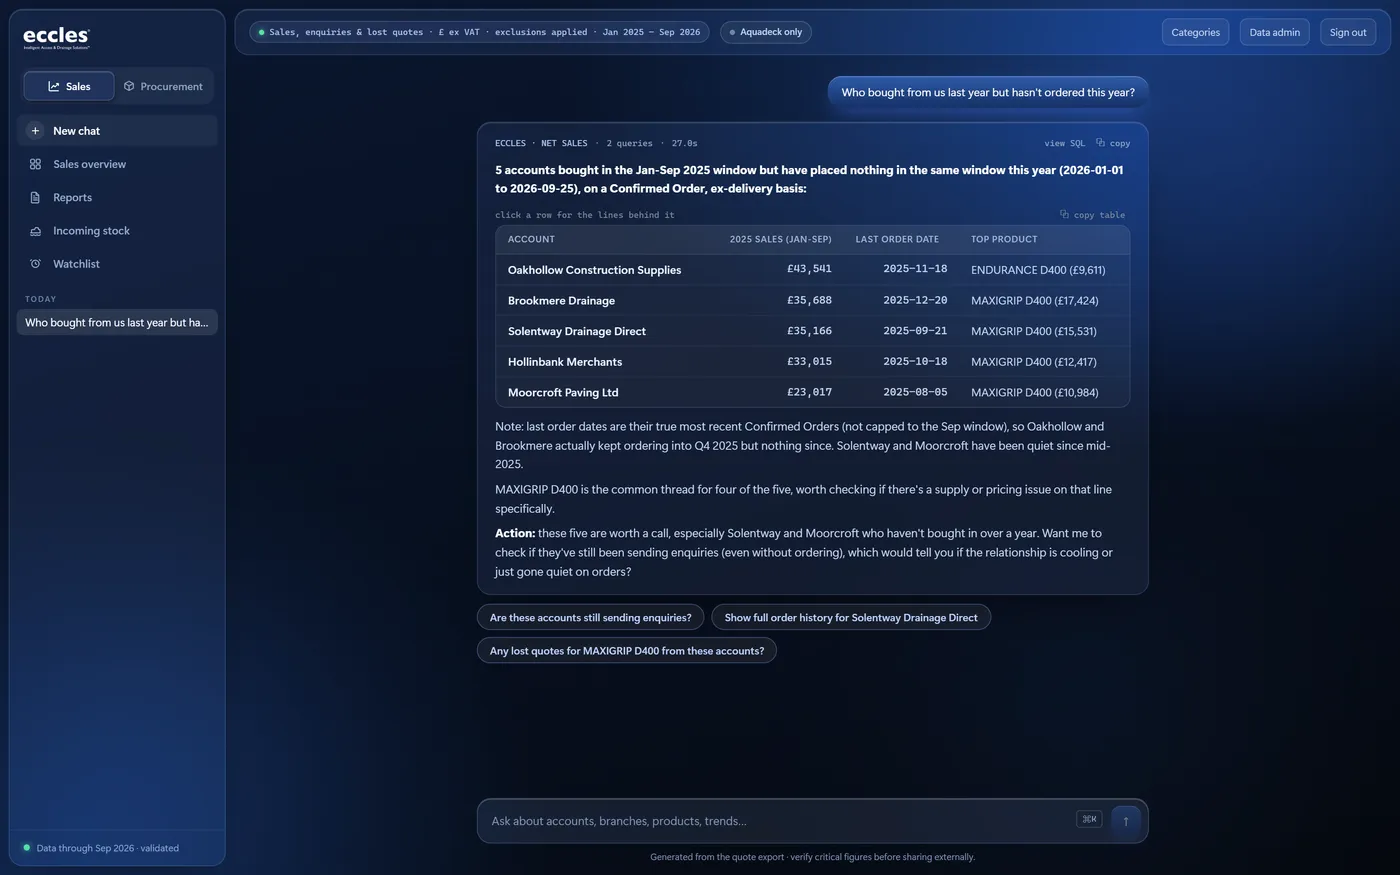
AI layer.
A Monday briefing linking sales, supply risk, lost business and accounts to chase. Alerts that flag when data is out of date. A chat interface that answers questions about live data in plain English, such as “Who bought from us last year but hasn't ordered this year?”
- 04
Built-in data checks.
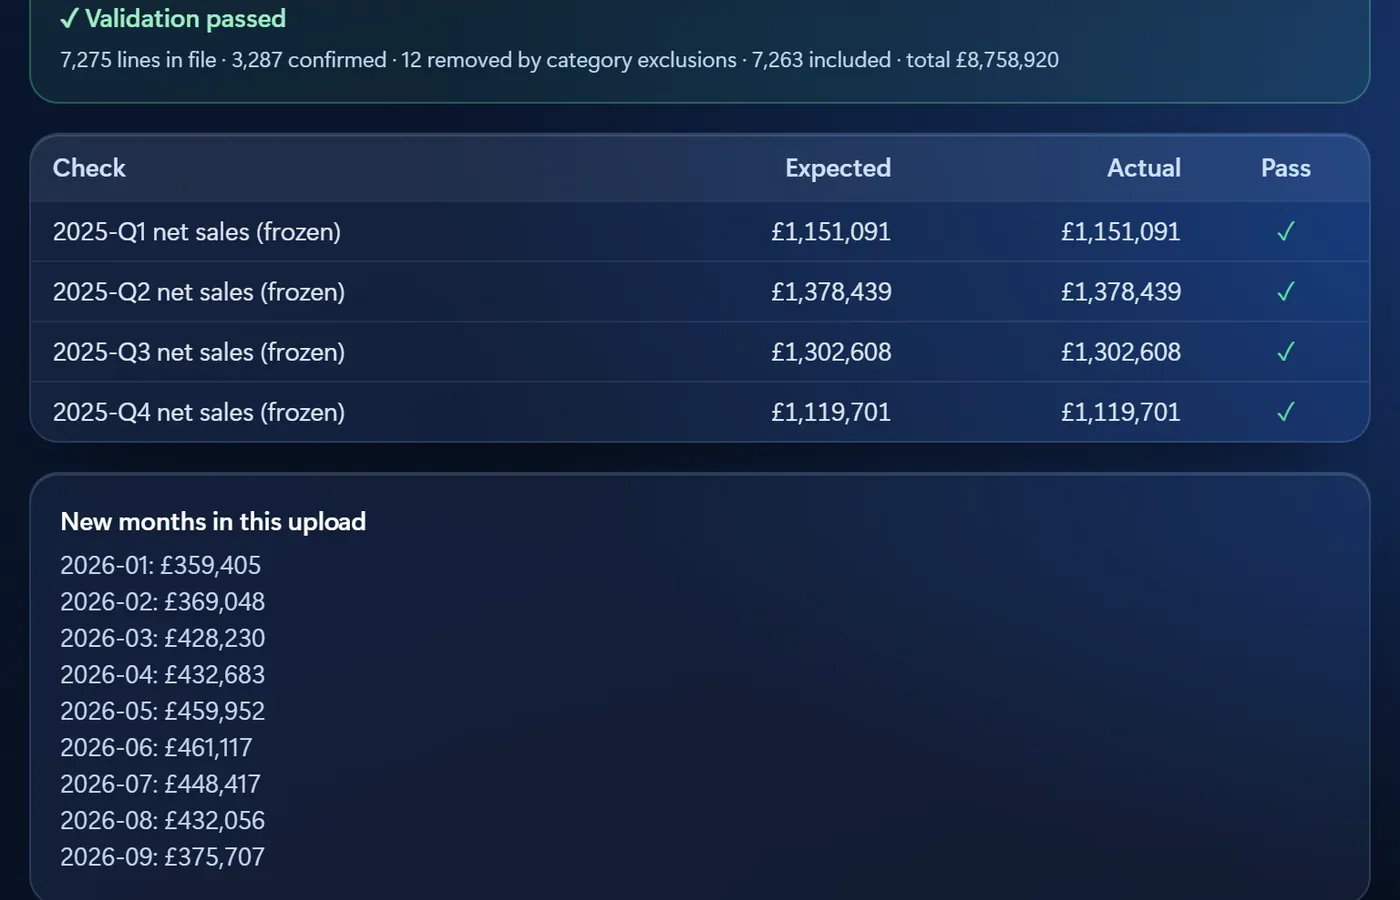
Each monthly upload is validated before the system answers from it, so the numbers stay trustworthy.
Drill down
Click any number to see what sits behind it: the accounts, then the branches, then the products and quote lines.
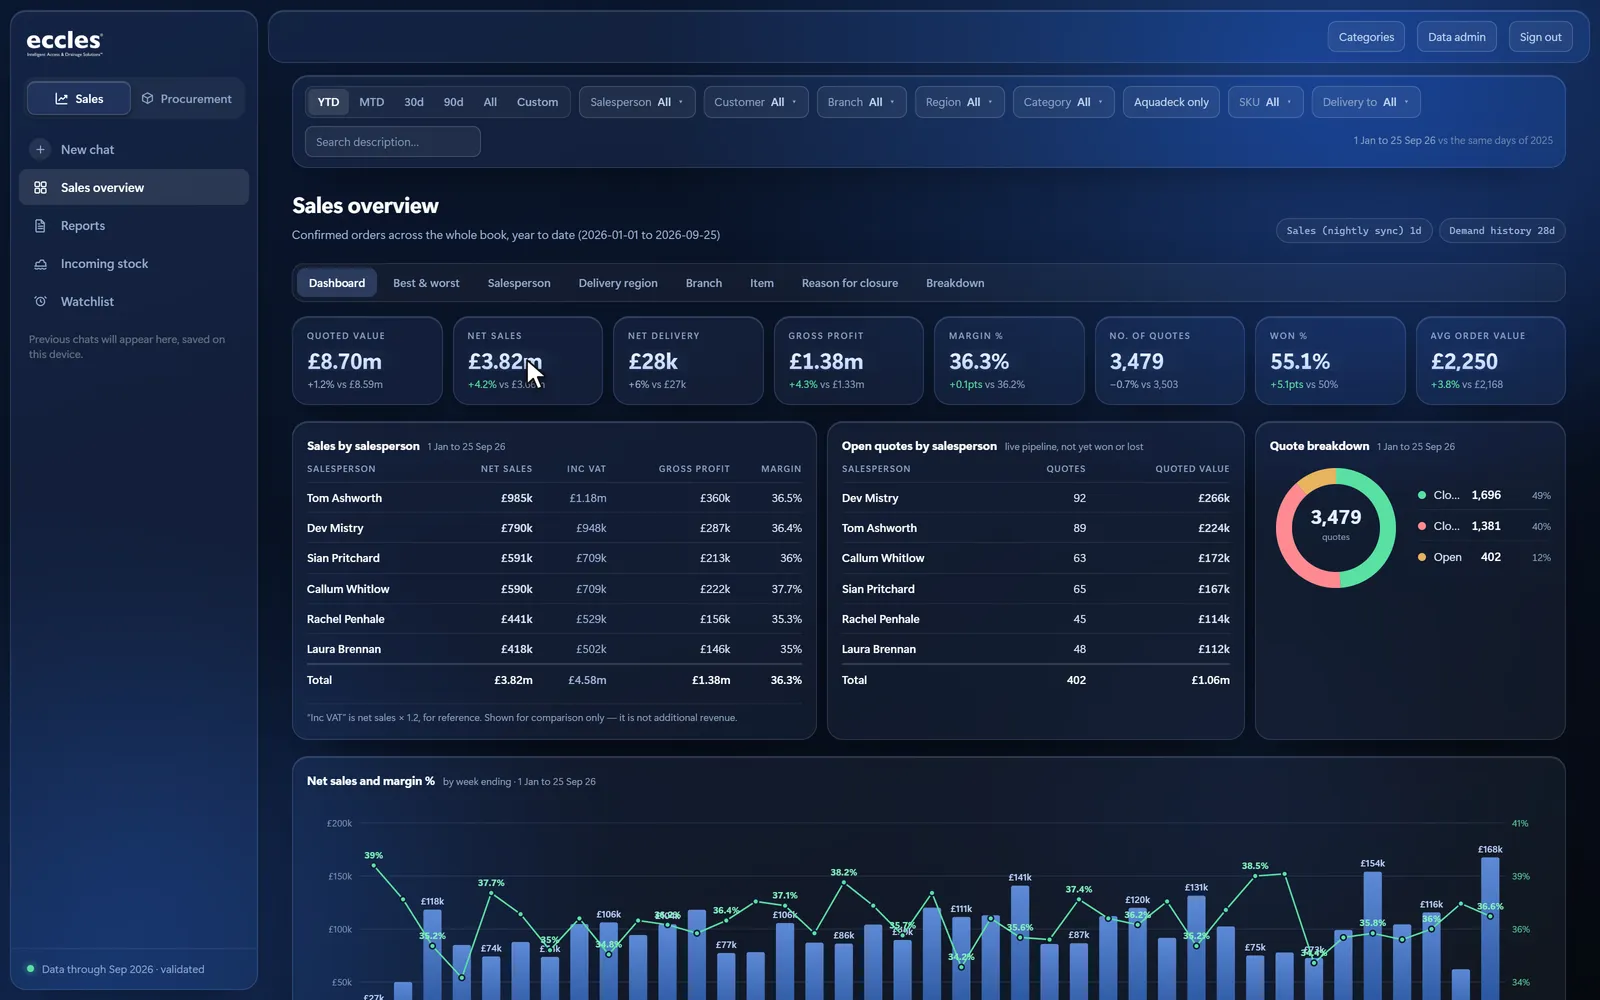
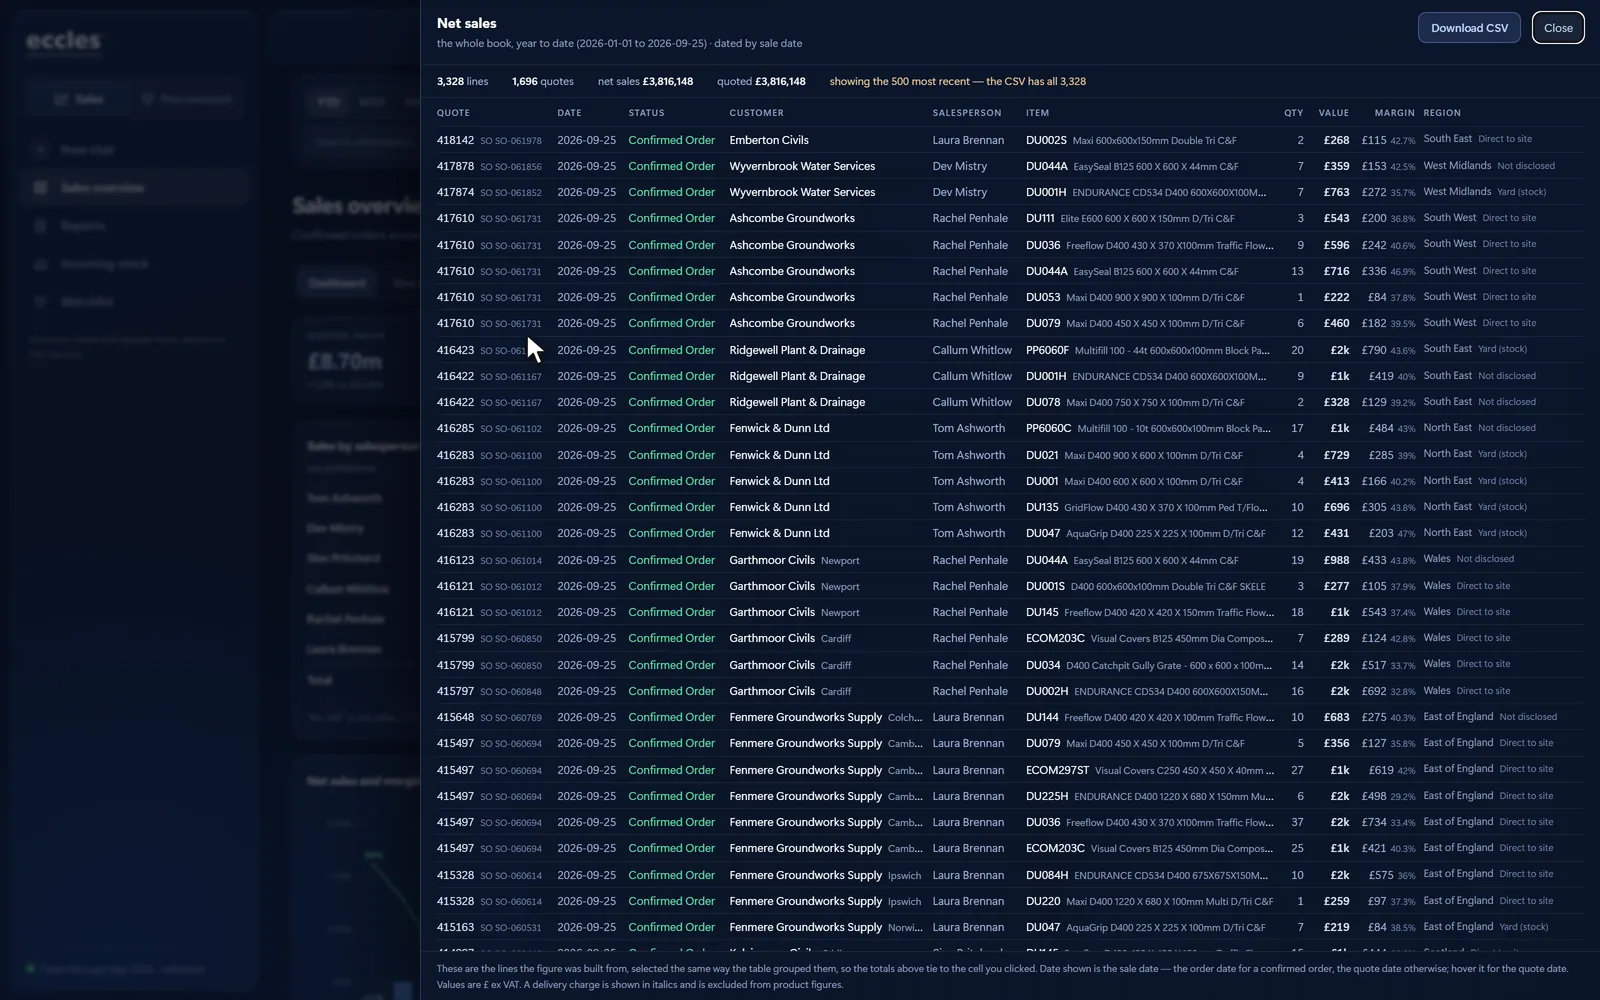
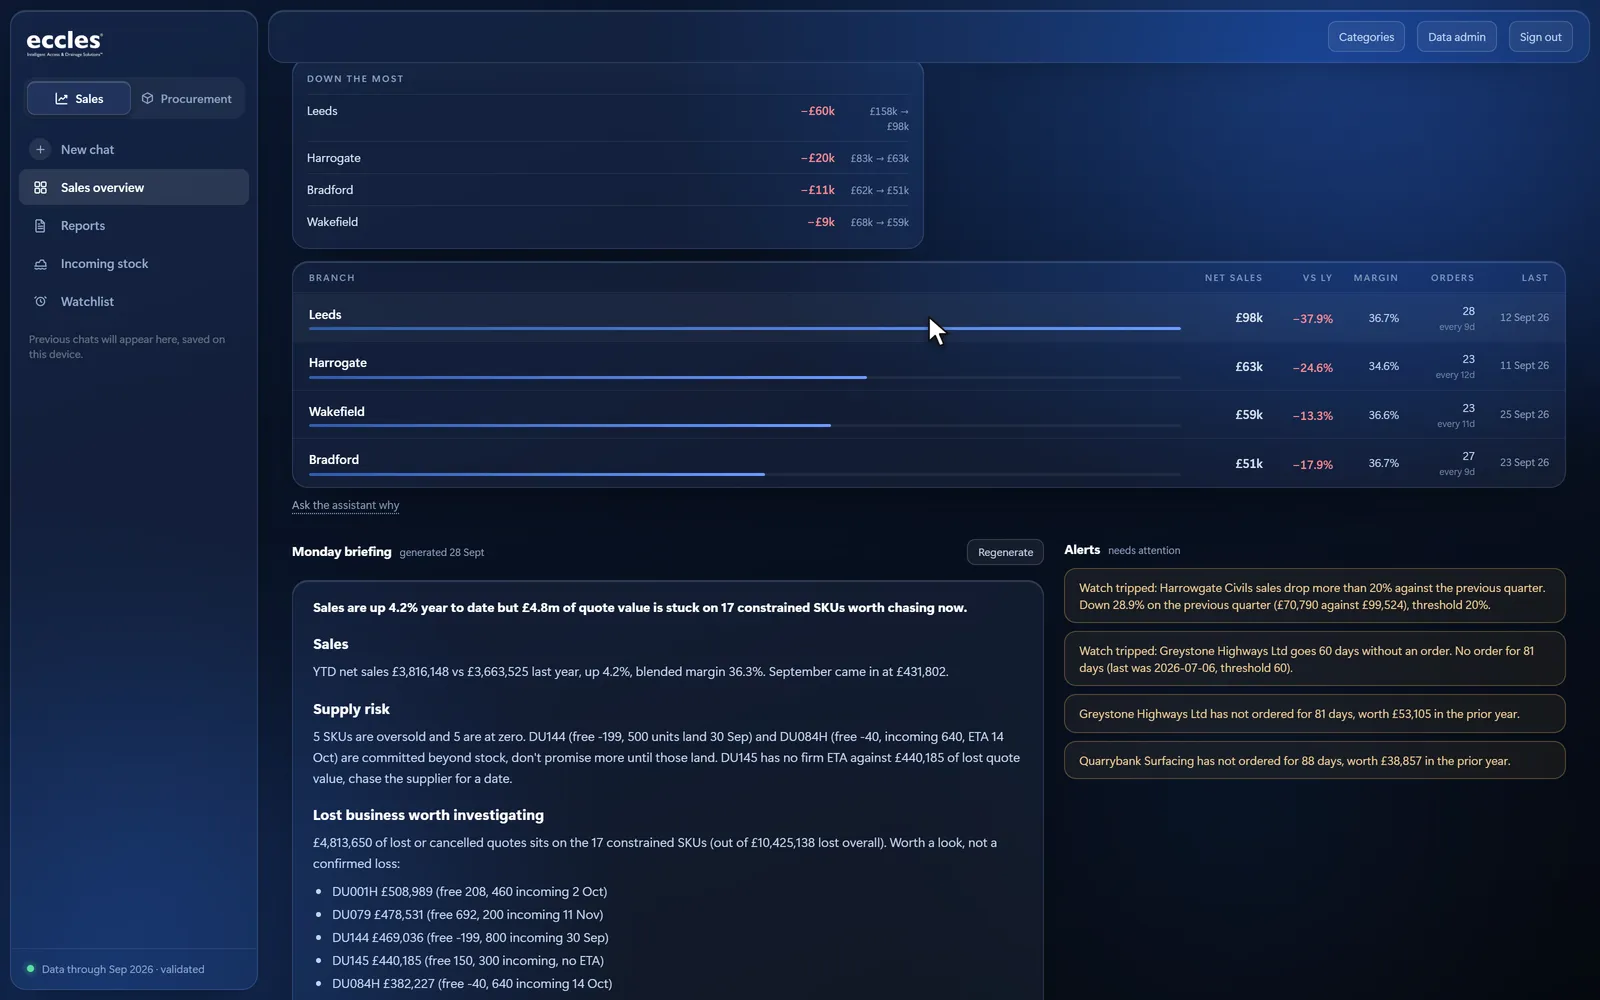
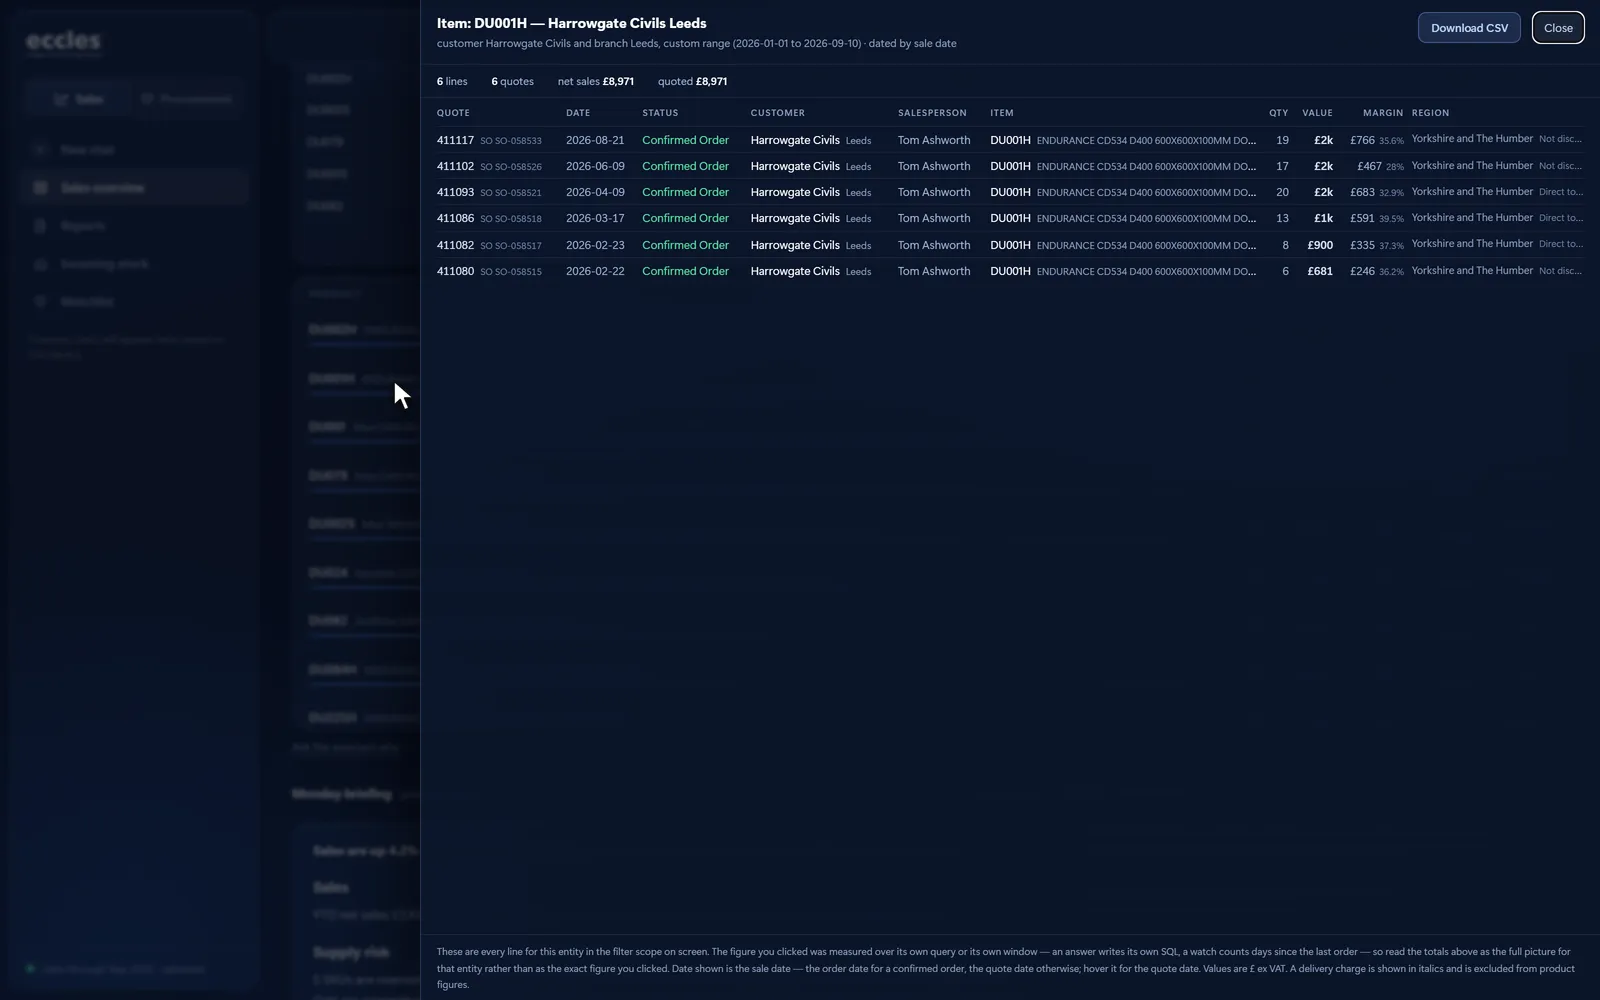
Start from any figure on the dashboard, here year-to-date net sales.
Command is advisory: it recommends, and people decide. Access is secure, by magic-link sign-in.
03See it in action
Three short demo videos, recorded on dummy data.
Results
- Days to minutesMonthly sales analysis, from days in spreadsheets to minutes
- 27,000+27,000+ quote lines analysed every month
- 95%Reorder targets set to a 95% service level

Your sales and stock data already hold the answers. Command puts them in front of you every Monday.
Book a demo